ppwe computes the cumulative distribution function (CDF) or survival rate
for a piecewise exponential distribution.
Arguments
- x
times at which distribution is to be computed.
- failRates
Piecewise constant failure rates in
rate,durationfor each piecewise constant failure rate period.- lower.tail
Indicator of whether lower (TRUE) or upper tail (FALSE; default) of CDF is to be computed.
Details
Suppose \(\lambda_i\) is the failure rate in the interval \((t_{i-1},t_i], i=1,2,\ldots,M\) where \(0=t_0<t_i\ldots,t_M=\infty\). The cumulative hazard function at an arbitrary time \(t>0\) is then:
$$\Lambda(t)=\sum_{i=1}^M \delta(t\le t_i)(\min(t,t_i)-t_{i-1})\lambda_i.$$ The survival at time \(t\) is then $$S(t)=\exp(-\Lambda(t)).$$
Examples
# Example: default
ppwe(seq(0:10))
#>  [1] 0.9258747 0.8572440 0.7937005 0.7637176 0.7348672 0.7071068 0.6803950
#>  [8] 0.6546923 0.6299605 0.6061630 0.5832645
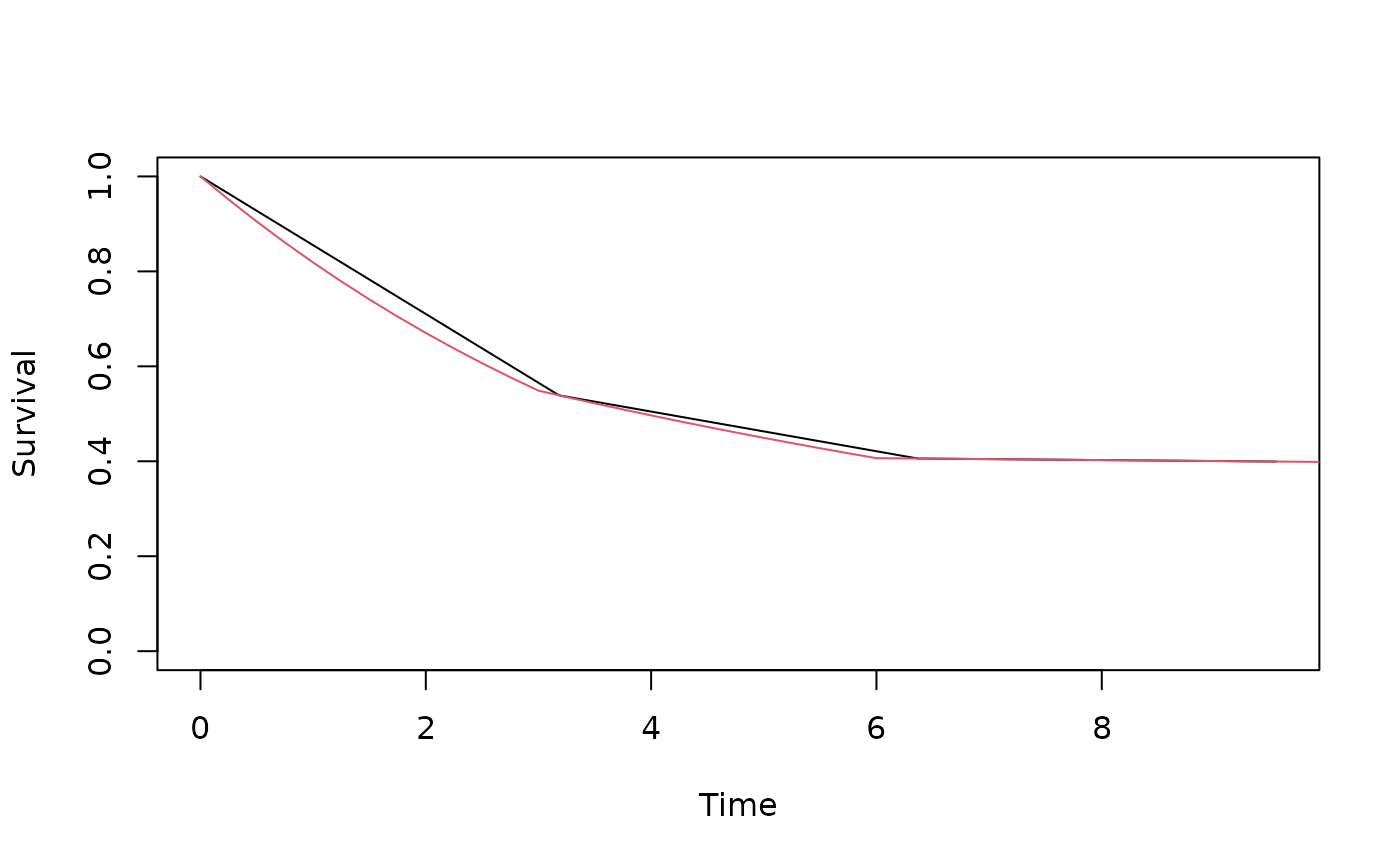
# Example: plot a survival function with 2 different sets of time values
# to demonstrate plot precision corresponding to input parameters.
fr <- tibble::tibble(duration=c(3,3,1),rate=c(.2,.1,.005))
Time <- seq(0,10,10/pi)
Survival <-  ppwe(Time,fr)
plot(Time,Survival,type="l",ylim=c(0,1))
Time <- seq(0,10,.25)
Survival <-  ppwe(Time,fr)
lines(Time,Survival,col=2)
